Back to site Construction
01 / Cover

Autonomous construction site monitoring

  • One analytics platform: drones, robotics, BIM and AI.
  • The technical scenario end to end — from the survey flight to the readiness report.

Plan vs actual control
against the digital model
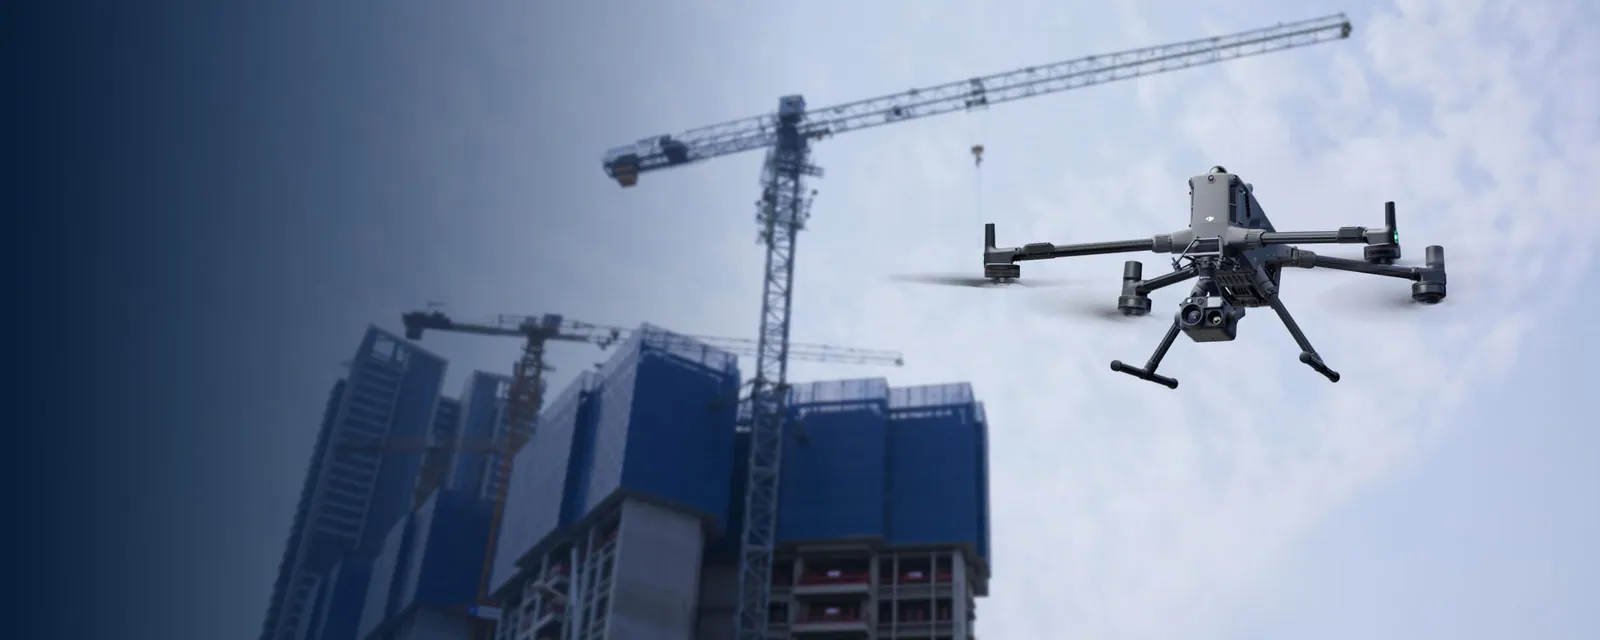
A drone surveying a building under construction with a tower crane
SITE SCAN: ACTIVE
MODEL: DAILY
MODE: AUTO
01 / 10
02 / Architecture

The architecture of autonomous site control
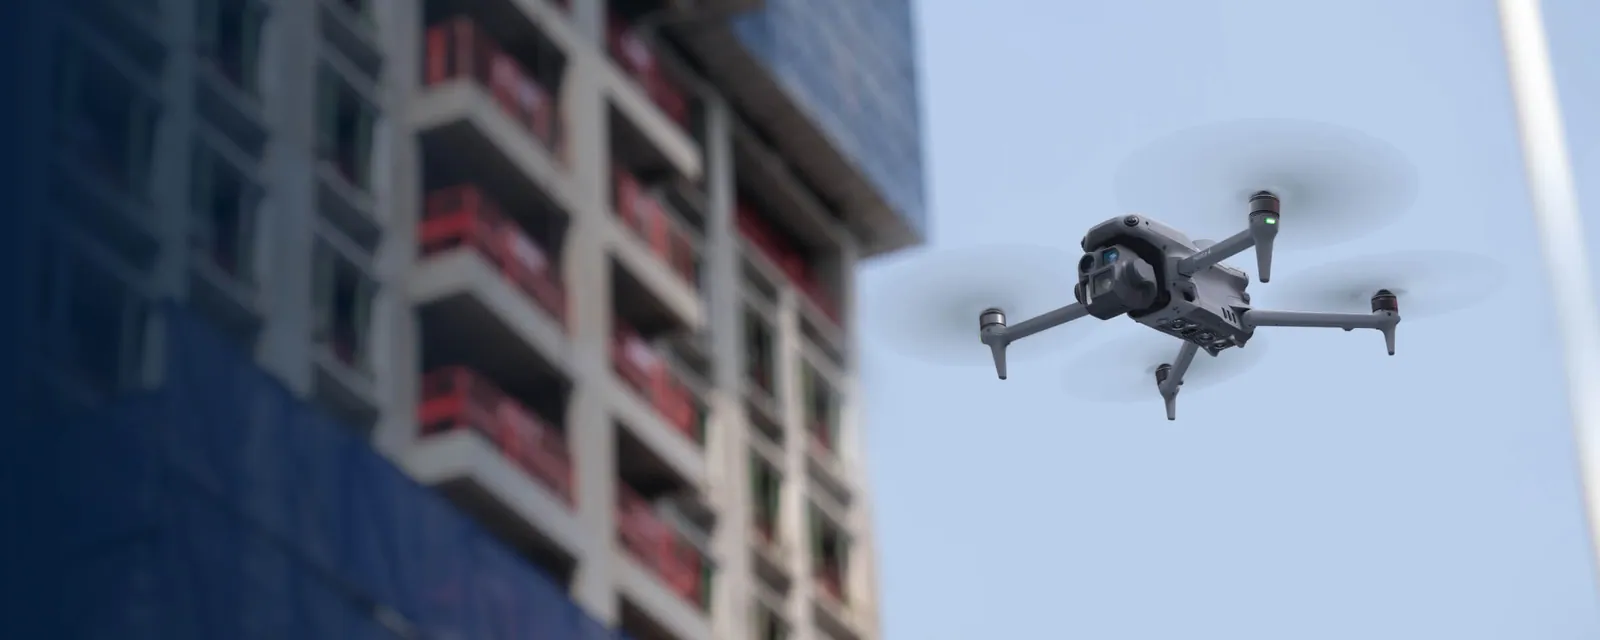
A drone capturing the facade of a building under construction
Step 1

Macro data capture

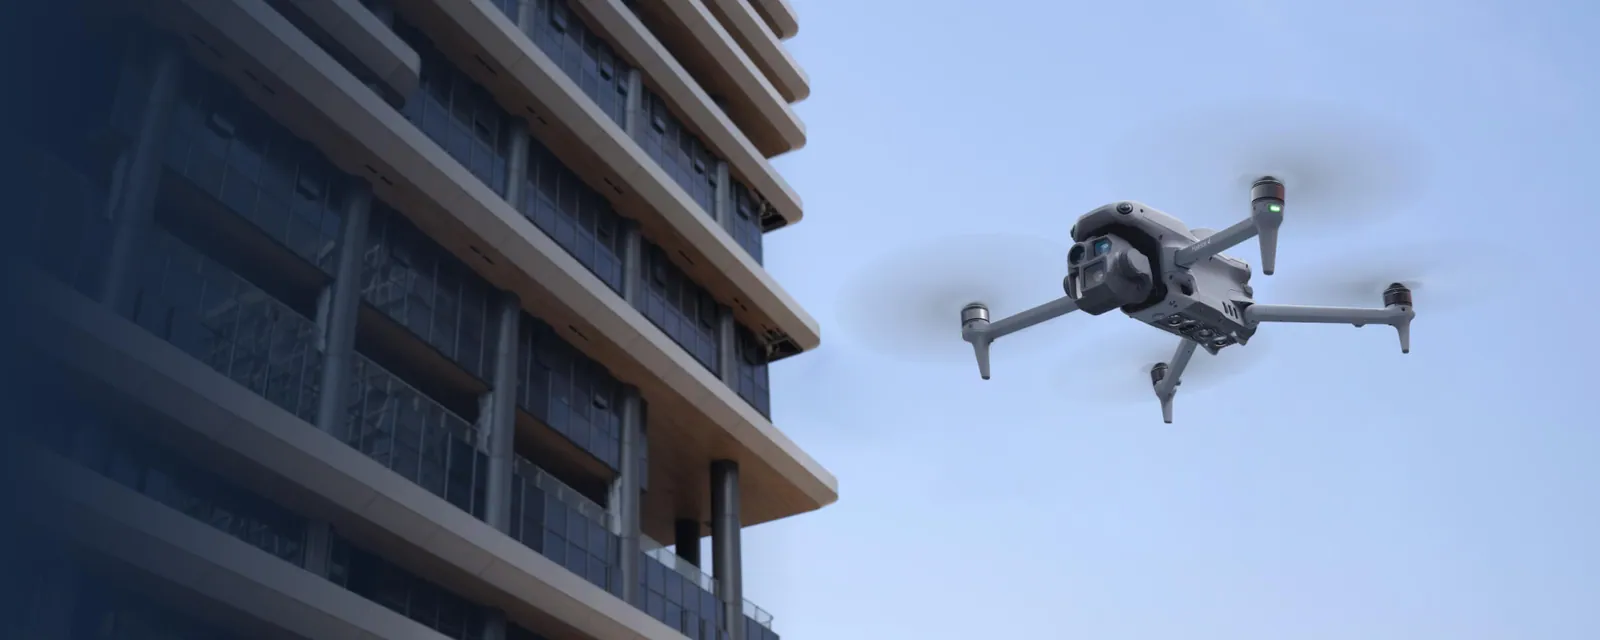
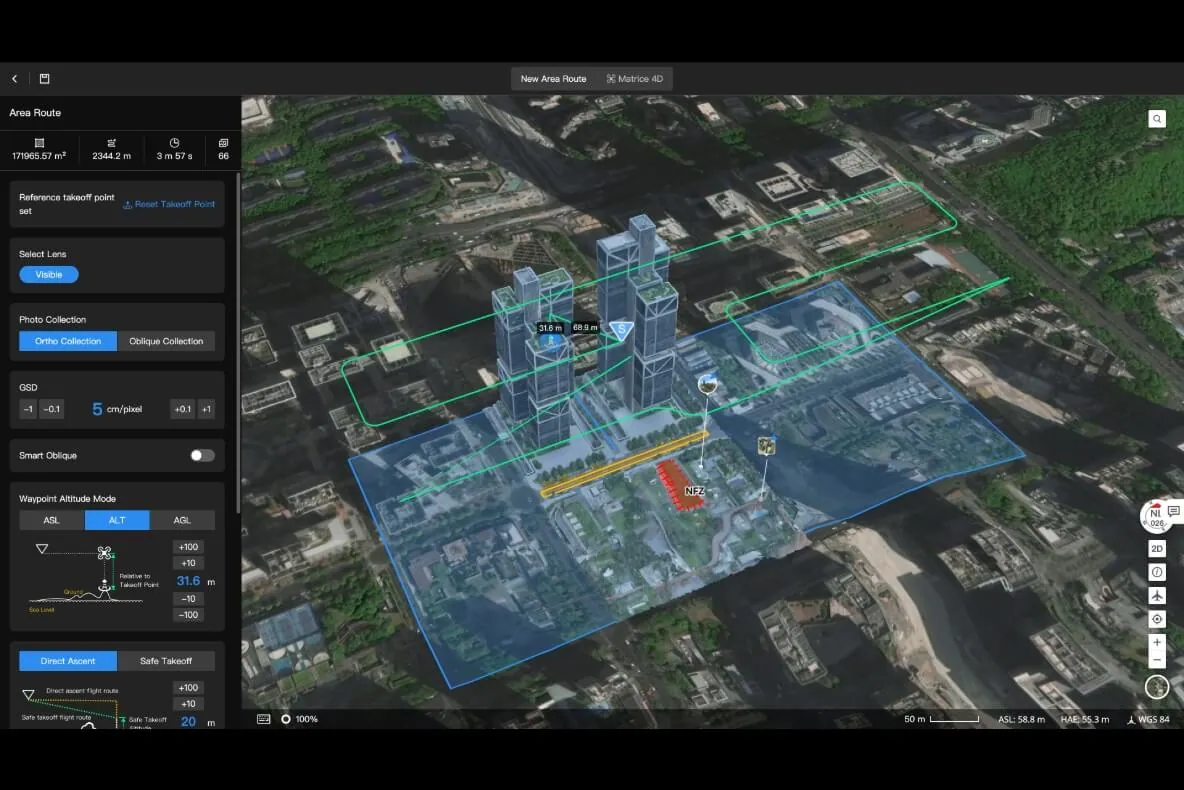
Drone survey flights along pre-planned routes.
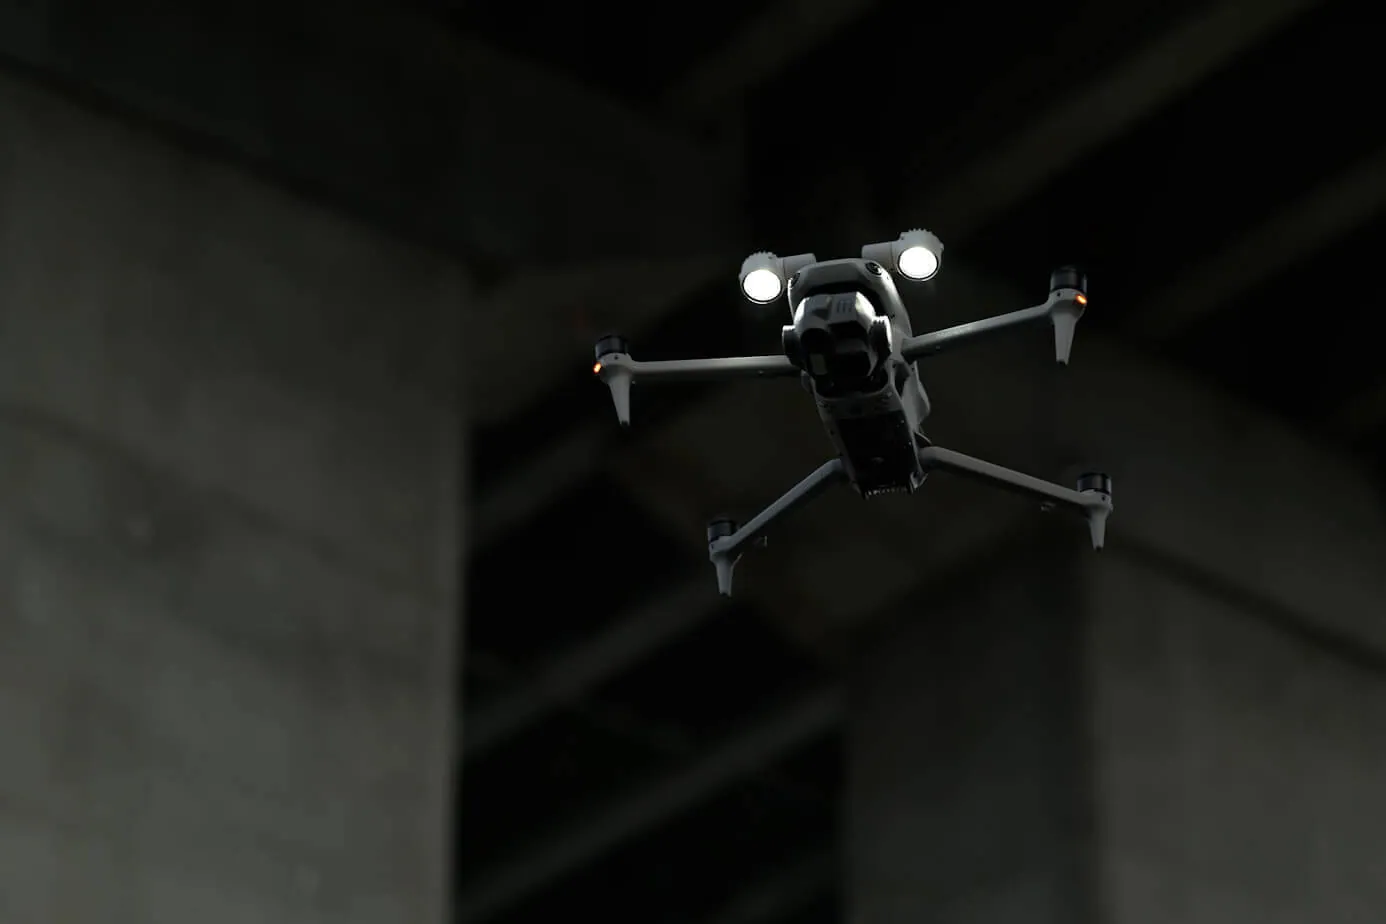
An aircraft scanning the space inside concrete structures
Step 2

Micro inspection

Scanning of enclosed areas and interior spaces.
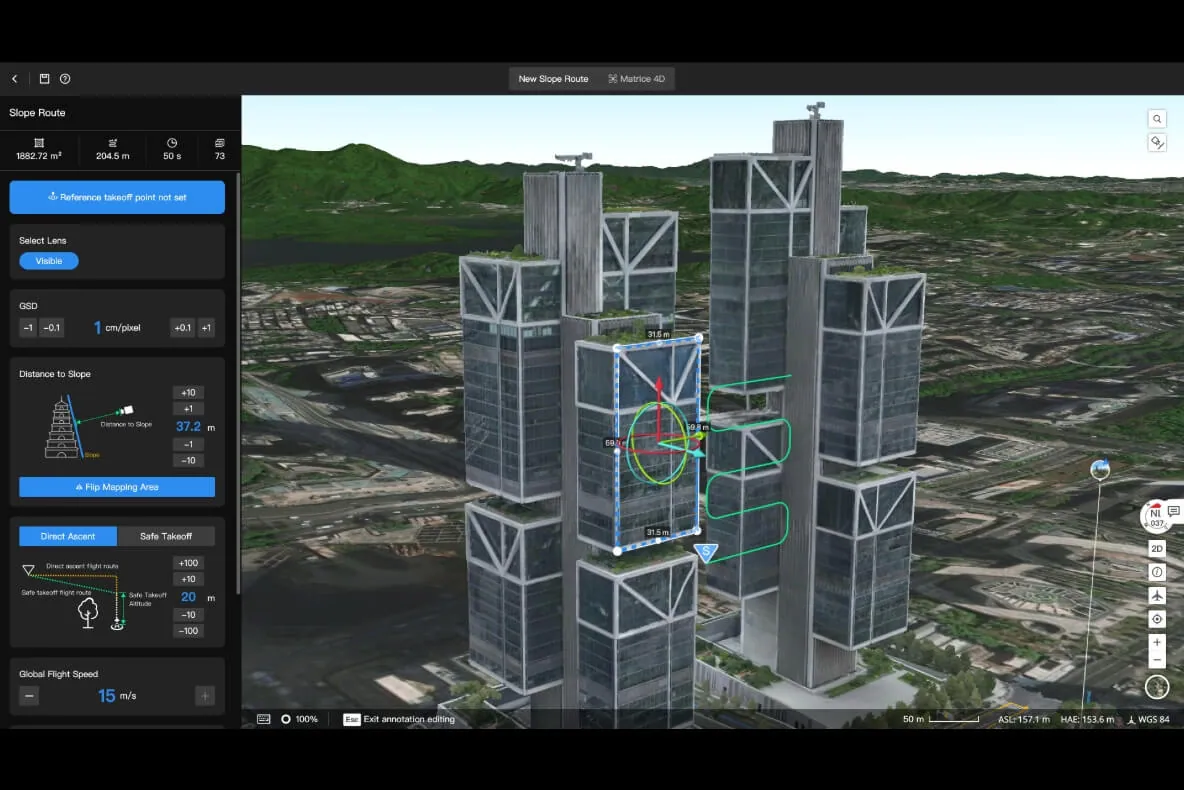
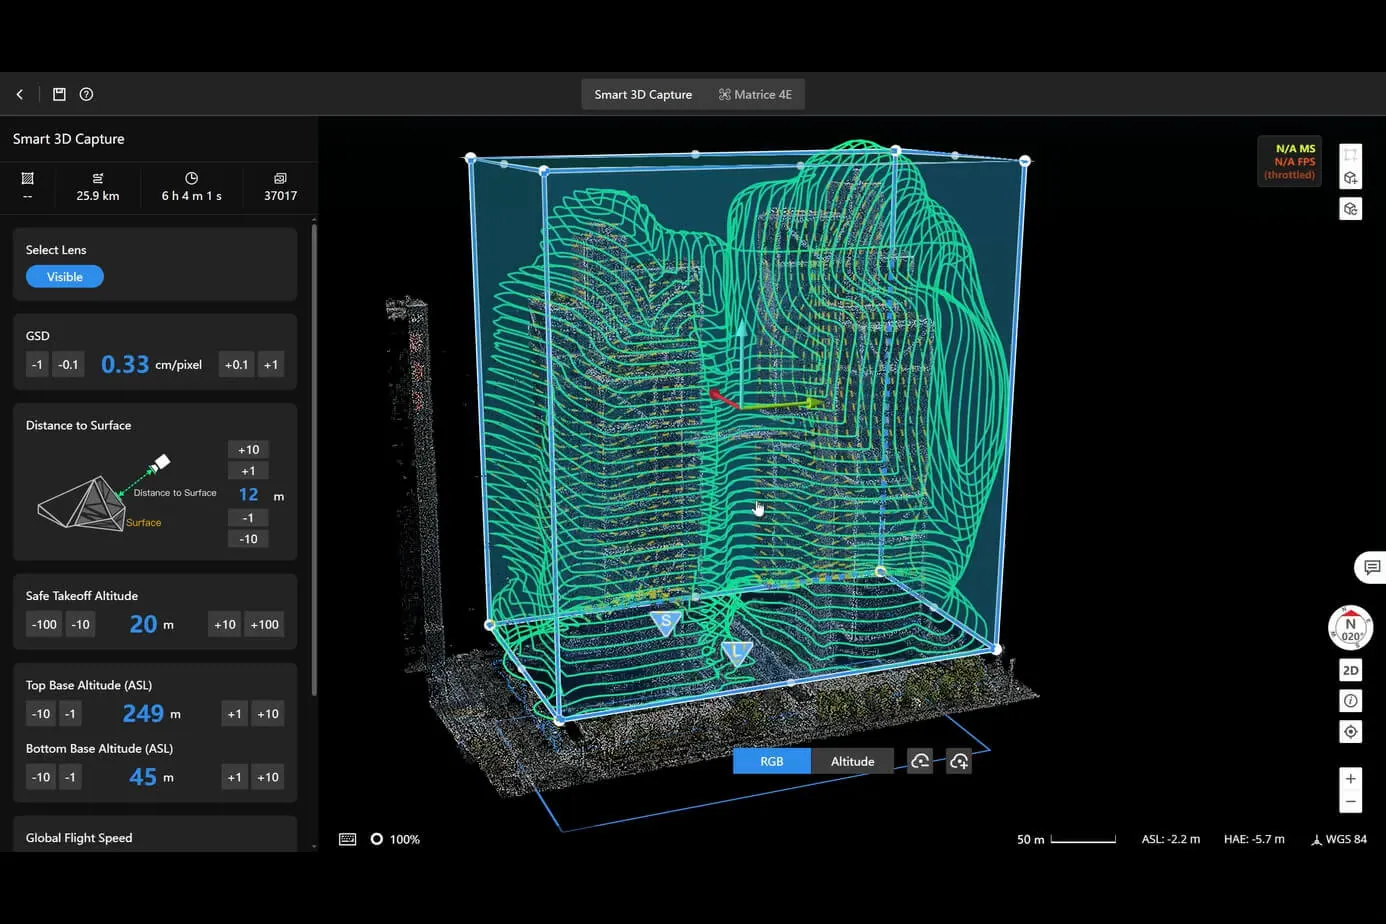
Three-dimensional model of buildings with the capture route
Step 3

Digital twin

The captured data is integrated with BIM and CAD.
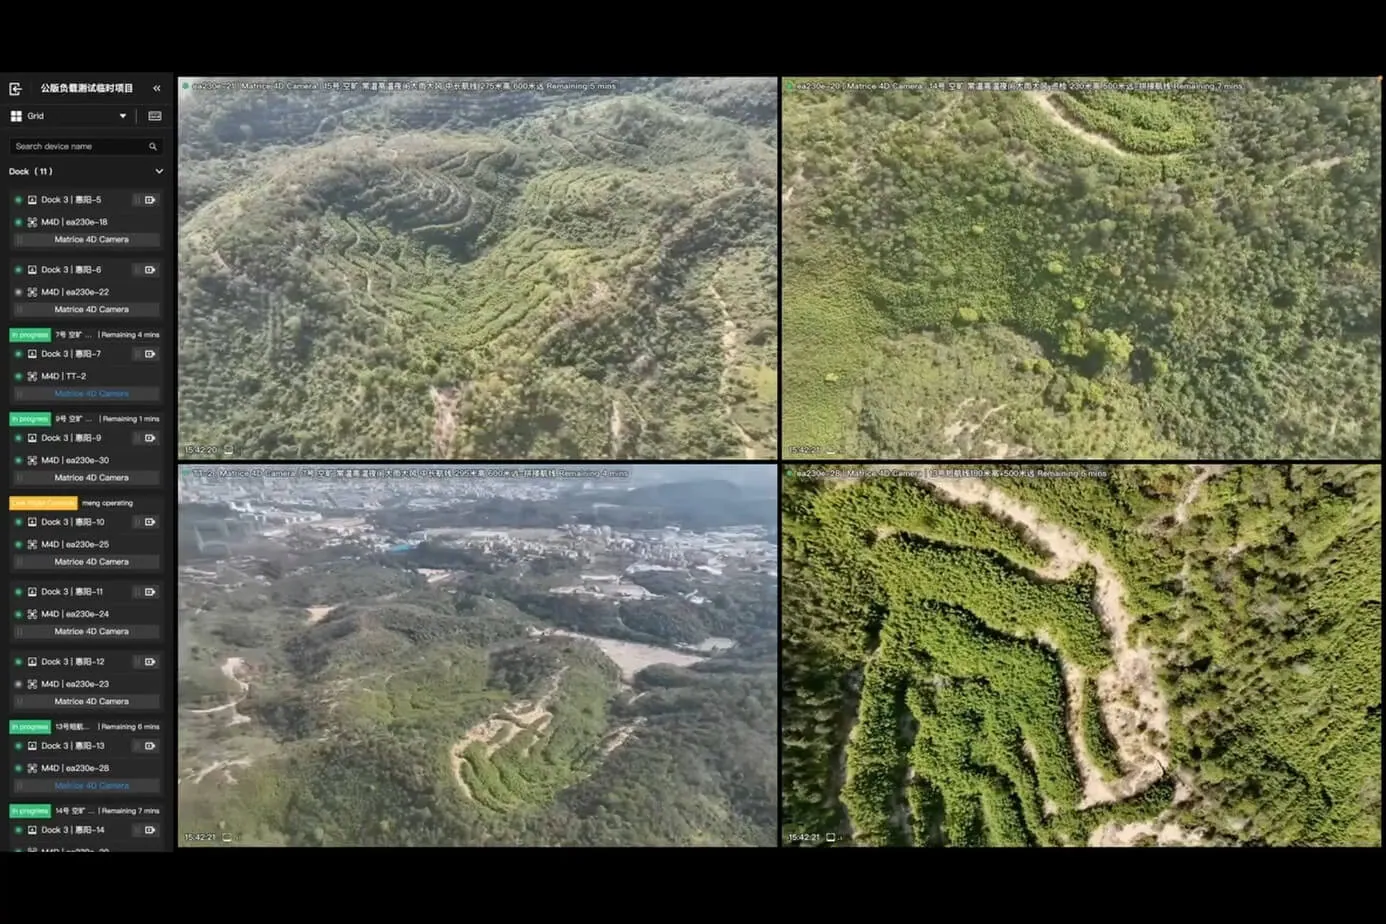
Interface with automatic analysis of site imagery
Step 4

AI analytics

Object recognition and report generation.

02 / 10
03 / Stage 1

The aerial survey creates a digital replica of the site

Automated drone flights along pre-planned routes continuously produce an up-to-date copy of the site.
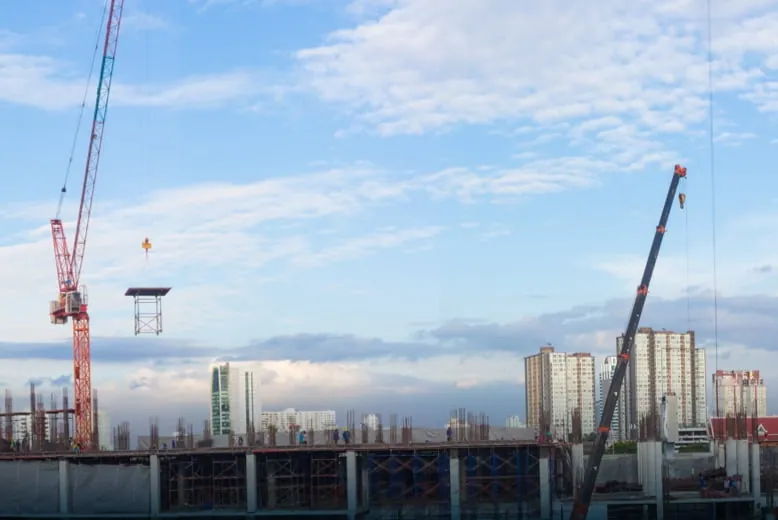
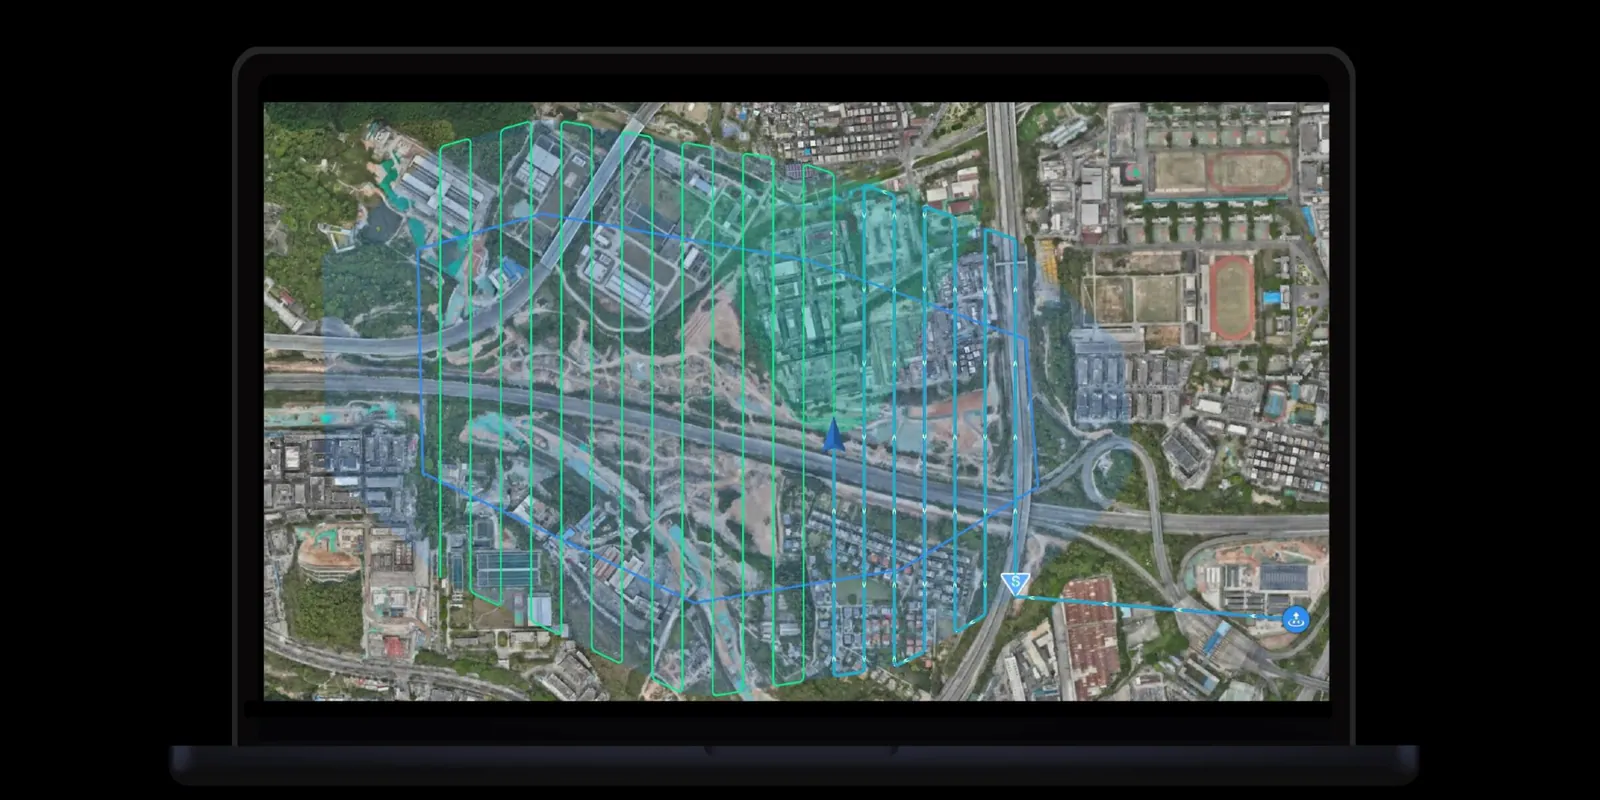
01Photogrammetric capture and an orthomosaic of the site.
02An up-to-date 3D model rebuilt on every flight.
03Oversight of machinery and personnel across the site.
04Cloud data transfer in real time.
A construction site with tower cranes seen from the air
Orthomosaic of the site on a laptop screen
03 / 10
04 / Stage 2

Robotic inspection of enclosed areas and covered works

Once the survey flight is done, the platform performs deep scanning of the interior using LiDAR, HD cameras and autonomous positioning algorithms.

  • Quality control of covered works.
  • Stocktaking of construction materials in storage.
  • Detection of deviations from the drawings.
  • Autonomous navigation inside the building.
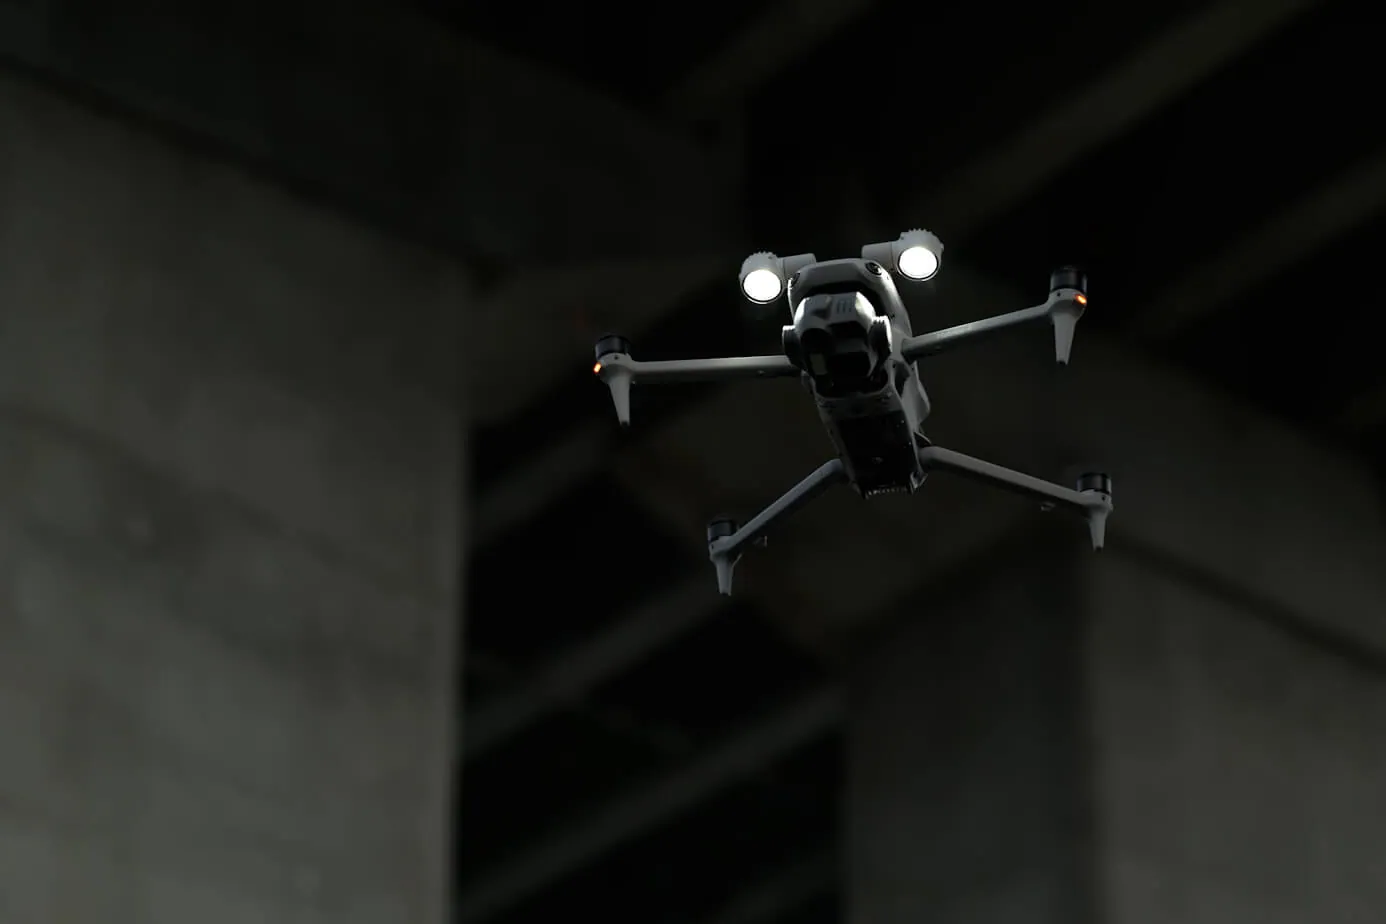
An aircraft inspecting floor slabs inside a building under construction
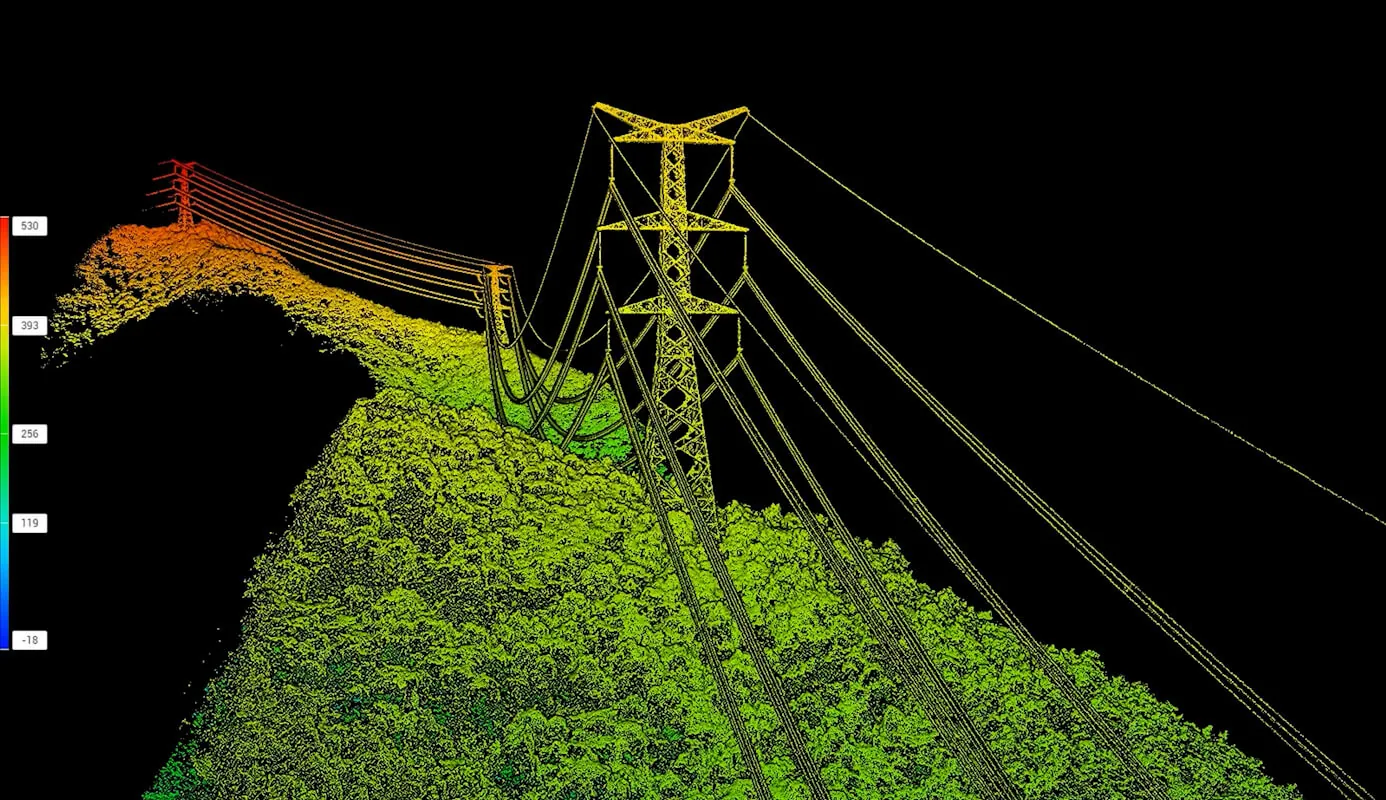
LiDAR point cloud of a structure
04 / 10
05 / Coverage

Full coverage comes from the synergy of macro and micro scanning

Panorama of the construction site shot from the air
An aircraft inspecting a building facade at close range
Parameter Aerial scanner (drone) Ground scanner (robot)
Coverage zone Outer envelope and site plan Interior spaces and floors
Type of data collected Orthomosaic, 3D wireframe Spot LiDAR scans, HD photos of joints
Key task Control of volumes and logistics Quality control and defect logging
05 / 10
06 / Stage 3

Matching physical reality against the design BIM model

The captured as-built data is overlaid automatically onto CAD drawings and the works schedule.
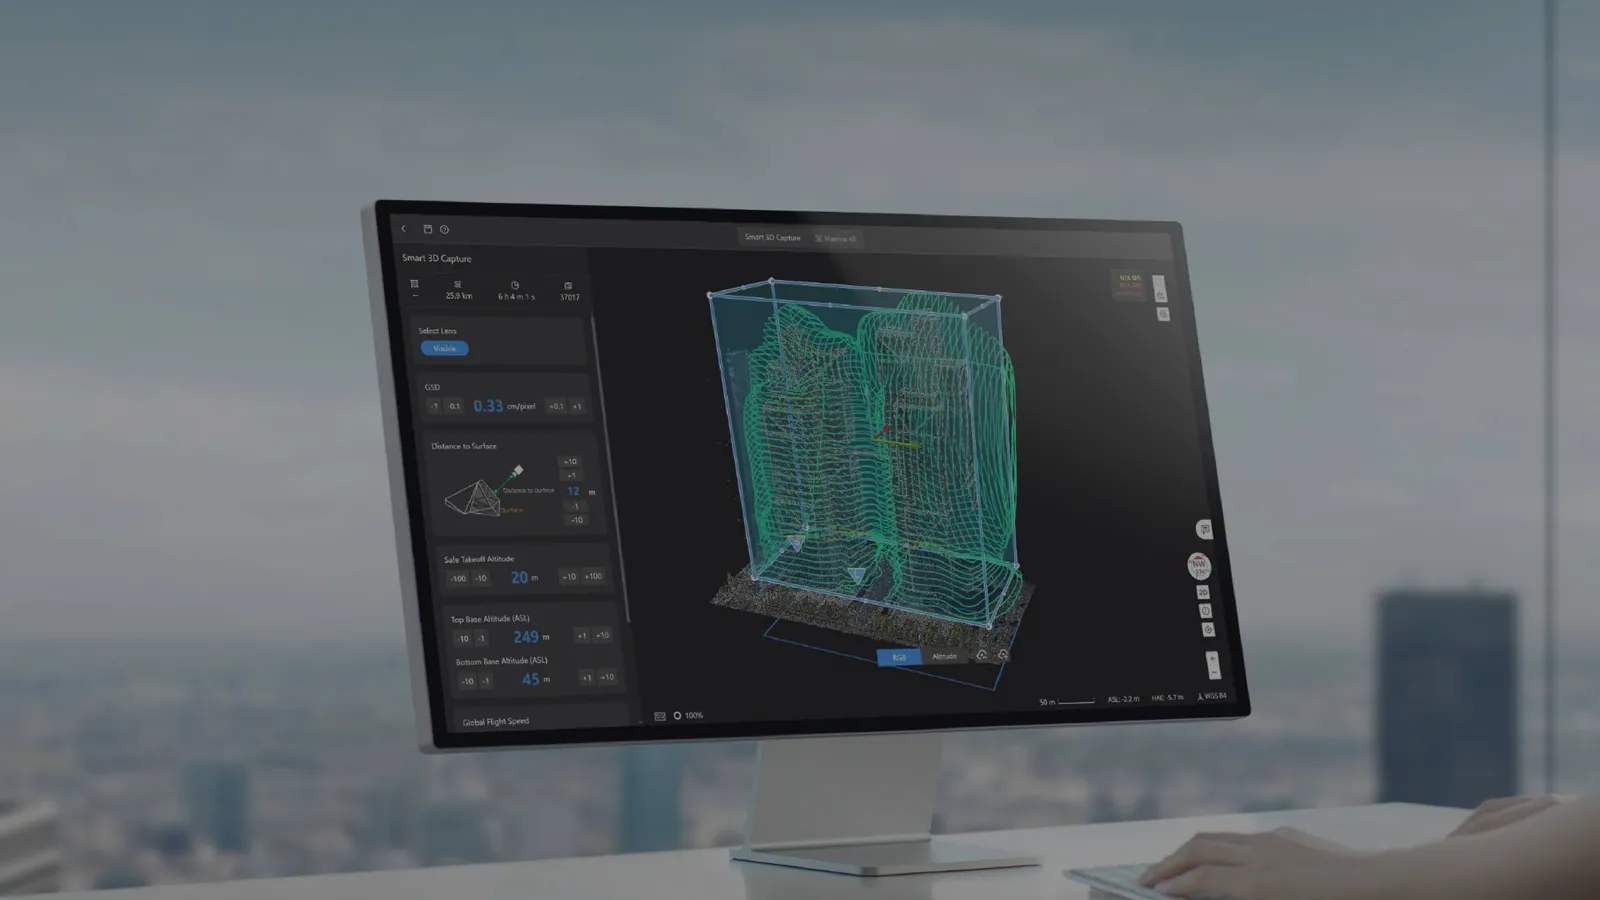
01Actual volume of completed work.
02Quantity of materials consumed.
03Deviations from design parameters.
04Adherence to the construction schedule.
Wireframe BIM model of a building on a workstation screen
Survey model overlaid on the three-dimensional wireframe of the site
06 / 10
07 / Stage 4

Neural networks classify objects and flag violations

AI algorithms analyse the visual data to generate analytical reports automatically.

  • Calculation of poured concrete volume.
  • Counting of installed elements and assembled structures.
  • Logging of construction defects.
  • Detection of safety violations.
Automatic analysis of the three-dimensional site model
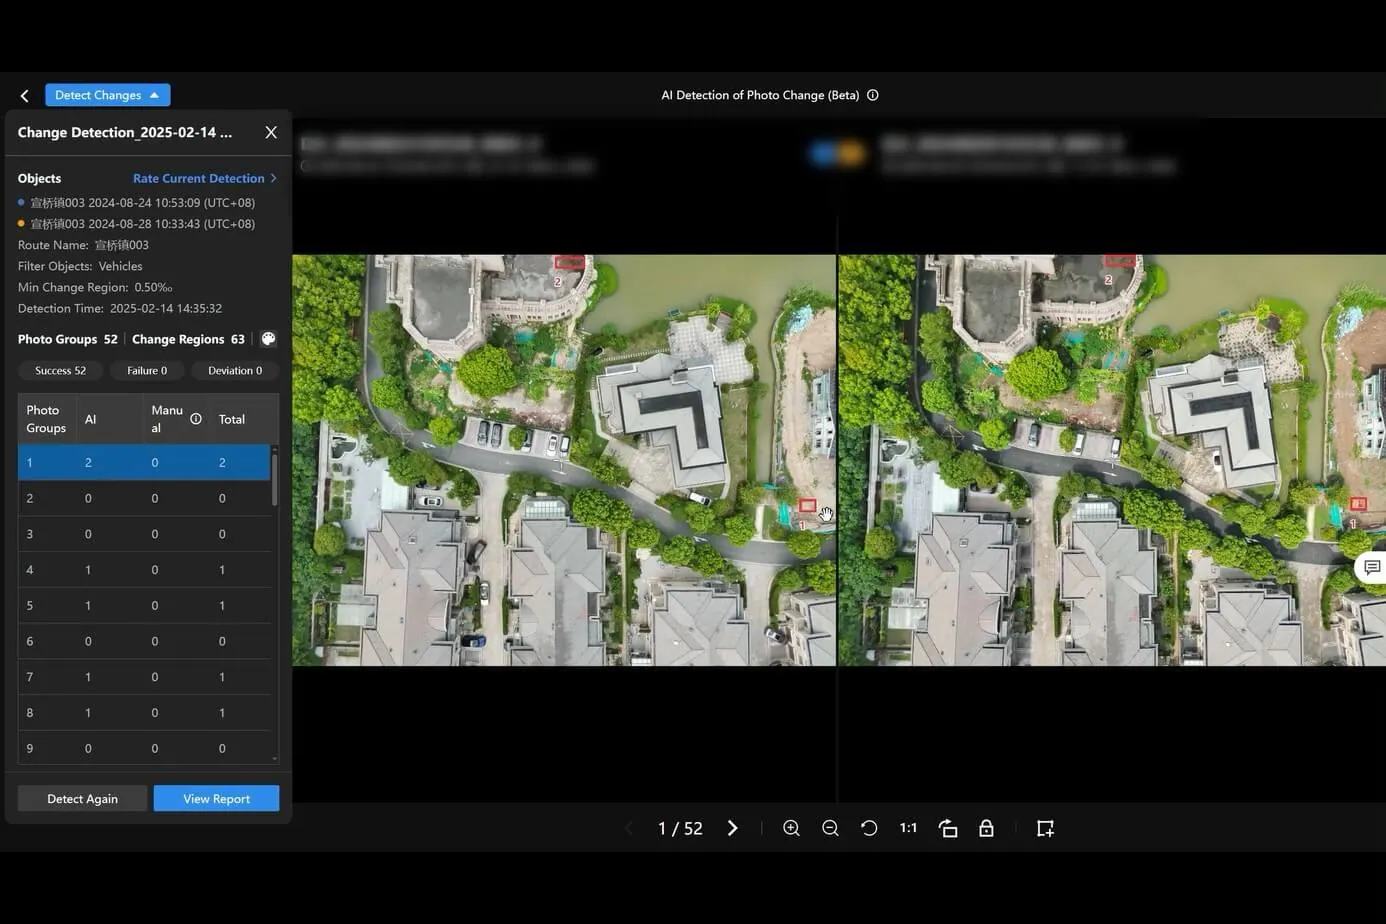
Two surveys of the site compared: the changes detected
07 / 10
08 / Volumes

Volumes and materials are calculated from the digital model
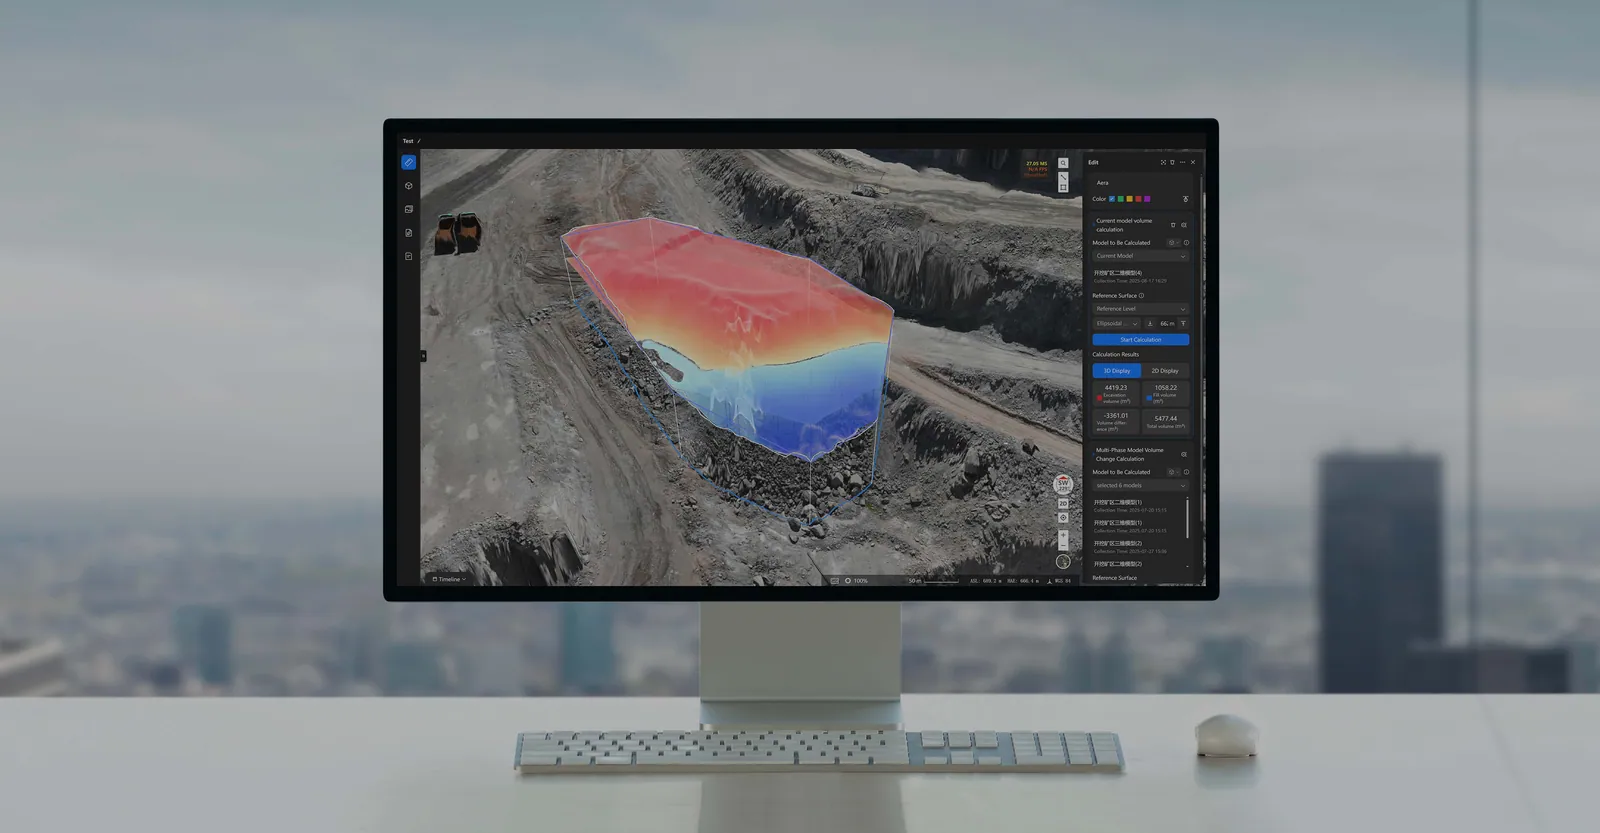
01Earthworks calculation: cut and fill are measured from the model, with no surveyor walking the pit.
02Stockpiles: the volume of spoil heaps and material piles on site.
03Change over time: comparing surveys shows the output for the period.
04Reconciliation: actual volumes against what the contractor has claimed.
Excavation volume calculated from the model on screen
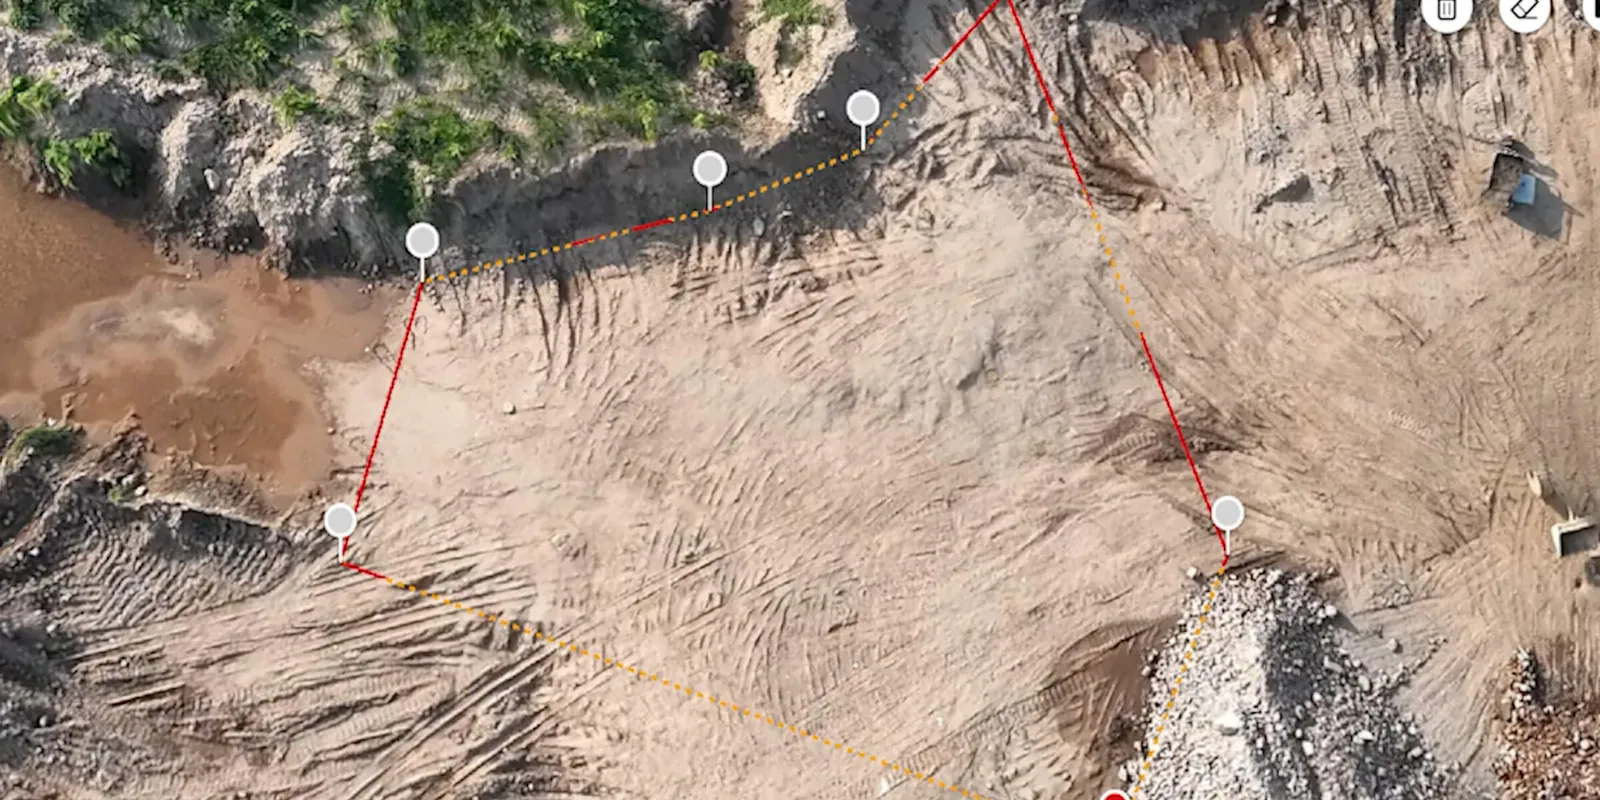
Excavation measured with survey points on the orthomosaic
08 / 10
09 / Summary

Live summary: real-time data for making decisions

68% Site readiness
Steel structure erection82%
Facade element installation54%
Utility network installation41%
Schedule: deviation+5 дней
Construction materials consumed — 72%
The summary is refreshed after every survey flight
09 / 10
10 / Impact

Automated control cuts risk and cost dramatically

−80%

Time spent inspecting the site. A survey flight instead of walk-rounds and manual measurement.

24/7

Digital twin refresh. Daily, with nobody on site.

100%

Transparency. For the client, the contractor and the investor.
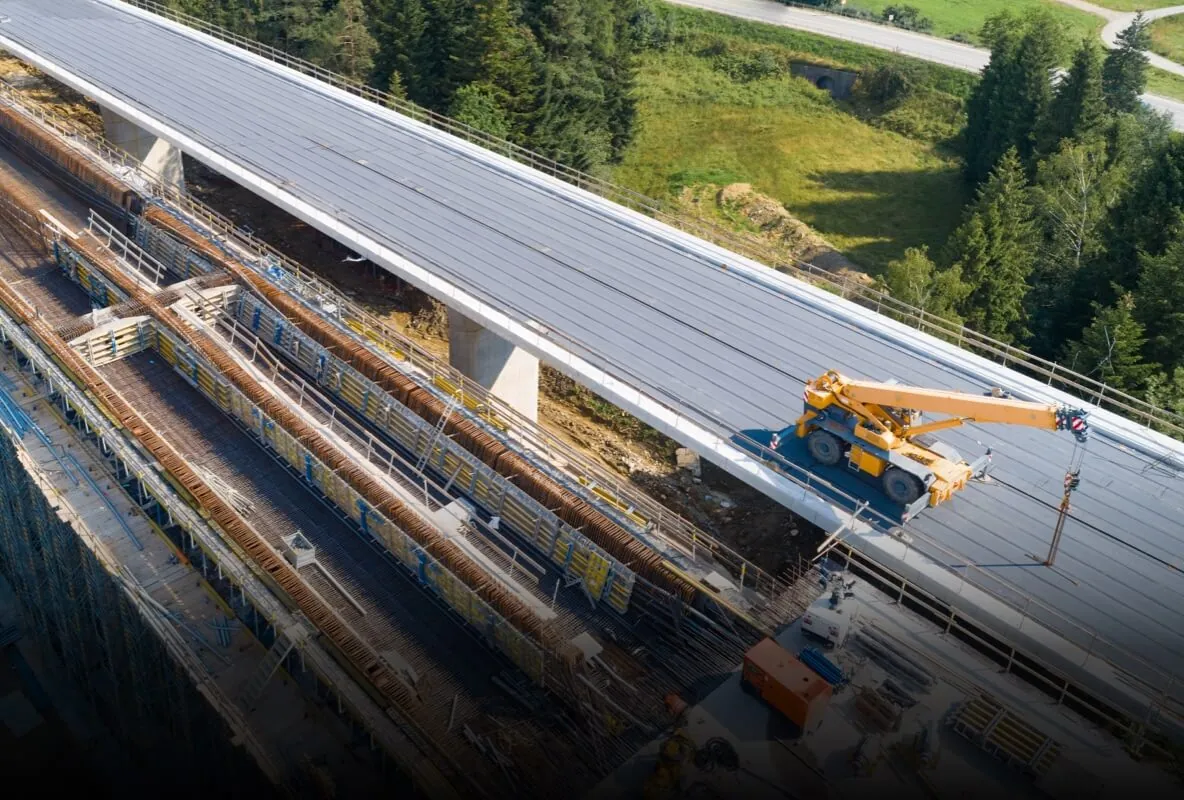
Construction of a road interchange seen from the air
The system calculates construction readiness automatically and all but removes the human factor from progress control
10 / 10